
October 12, 2026
| BY Glen McLaughlin
Taking a Step Back: A 30-Year Look at Interest Rates
Interest rates have been rising quickly in recent months, capturing widespread attention for good reason. It’s rare that interest rates move so quickly over such a short period of time, and we’re not just talking about one rate in particular, we are seeing it across the board, from short and long term bonds to mortgages and car loans.
When looking at bonds in a portfolio it’s important to keep in mind that bond prices and yields move inversely: as yields go up, prices go down. Investors typically rely on bonds for safety and stability. When bond prices drop quickly and unexpectedly, it naturally spooks people.
While writing a recent note to clients, I decided to step way back, and look at bond yields over a very long time horizon, thirty years to be exact. I focused on the 10 year US treasury bond because it’s a common barometer for global interest rates, and things like home mortgages.
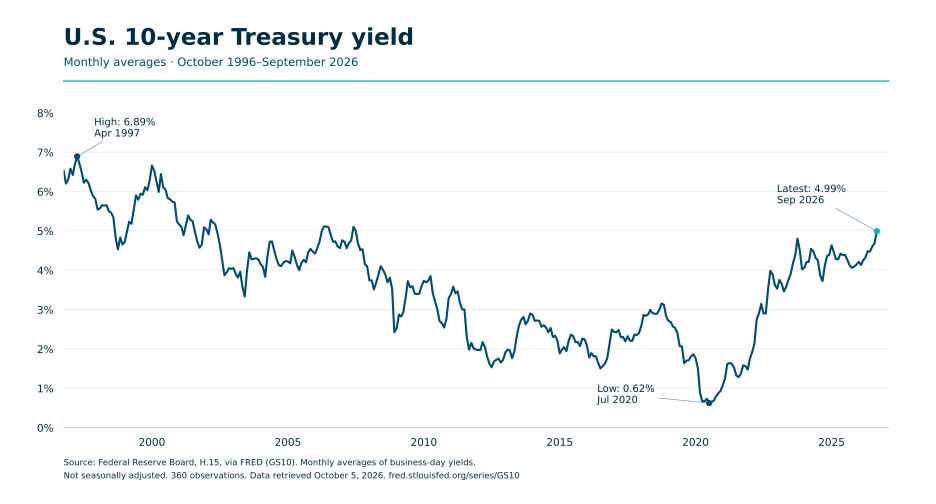
The chart above tracks the yield on the 10 year US Treasury bond on a monthly basis over the last thirty years. You’ll notice the yield trended down for almost a decade following the financial crisis, remaining low for some time as markets recovered and the Fed kept rates near zero.
Eventually, the yield began to climb as it headed back toward long term averages. The pandemic then brought yields back down as investors bought bonds in a flight to safety, and the Fed dropped the federal funds rate to zero. Finally, post pandemic inflation fighting, coupled with a healthy economy, sent yields heading upward once again.
There is a statistical concept in markets called “regression to the mean,” and the idea is that over long periods of time prices or yields will almost always return to long term averages.
This does not mean the reasons for any given move are inherently “good” or “bad”; statistics are indifferent to the underlying triggers. The current run up in interest rates has been driven by inflation, the US budget deficit, and some of what’s called “crowding out” in the bond market.
Inflation has been triggered by US tariffs, high oil prices due to the war with Iran, and a Federal Reserve that has been largely reluctant to raise rates in response. If the bond market doesn’t believe the Federal Reserve will raise short term rates to combat inflation, it will demand a higher yield for all bonds as compensation.
The US is currently running a budget deficit of around $2 trillion dollars. Historically, budget deficits are viewed as somewhat acceptable when the economy is in trouble, such as during the pandemic and financial crisis. In those times, government spending boosts the economy to compensate for the lack of spending by households and businesses. The current situation is very different; the US is in the midst of a healthy economic expansion and unemployment is historically low. US borrowing has reached an extreme where the bond market is demanding higher yields, which should make intuitive sense. People with low or no debt can typically borrow money at lower rates than people drowning in debt, and governments are no different.
The final concept, “crowding out,” related to the sheer volume of debt is being issued by companies to finance the buildout of artificial intelligence related data centers. This represents an enormous amount of borrowing by companies with excellent credit. At some point there is only so much money out there to buy bonds. As a result, companies, governments, and households are forced to pay more in order to attract lenders or bond buyers.
So, what does this mean for your portfolio? If your long term allocation already reflects your true risk tolerance, the solution is simple: stick to your rebalancing strategy. You’ll naturally trim your winning stocks to buy bonds while they are on sale. Plus, if you own bond funds and reinvest the monthly interest payments, you’re buying new shares at these higher yields—an easy win.
Eventually, when a slowing economy brings rates down, you will enjoy the exact opposite of what we’re seeing now: yields will fall, bond prices will rise, and your fixed income holdings will enjoy a lift.
However, if you’re not sure about your current risk tolerance, or you’re wondering how much you should be holding in stocks or bonds, let’s talk. We are here to help you navigate it.
Buoyant Financial, LLC is a registered investment adviser located in Charlotte, NC. Buoyant Financial may only transact business in those states in which it is registered, or qualifies for an exemption or exclusion from registration requirements. A copy of Buoyant Financial’s current written disclosure statement discussing Buoyant Financial’s business operations, services, and fees is available at the SEC’s investment adviser public information website – www.adviserinfo.sec.gov or from Buoyant Financial upon written request. This note is for informational purposes only, and should not be construed as investment advice, or a recommendation to buy or sell securities.